On tests, sensitivity, and specificity
Disclaimer: This page neds javascript to render LaTeX and Bokeh content.
I few days ago I was reading a Spanish newspaper and one of the headlines was how the government had acquired some tests with a sensitivity of 30% [1]. The article indicated that this was bad. But how bad? I wondered. What does it mean exactly?
In this entry I will explain the following terms:
- Sensitivity, also known as true positive rate, the recall, or probability of detection.
- Specificity, also known as true negative rate.
- Predictive Positive Value, also known as precision.
- Negative Predictive Value. I don’t think NPV is known by any other name in classification.
For convenience I will be talking about tests and prevalence of a disease. But a test is a binary classifier as well, and this explanation can be extended to any binary classifier.
At the end of this entry I will also provide an interactive widget that you can use to play with all the settings in a sample population, in order to get a gut feeling of what these concepts really mean, and how they interact with each other.
Basics
Let’s start by providing some simple definitions that will be used to define the terms in a frequentist paradigm:
- True Positive, TP: A positive case labeled as positive.
- False Positive, FP: A negative case labeled as positive.
- True Negative, TN: A negative case labeled as negative.
- False negative, FN : A positive case labeled as negative.
To understand the rest of the article we will only need these 4 definitions.
When talking about conditional probability, it’s usefult to remember Baye’s Rule:
$$ P(A|B)=\frac{P(B|A)P(A)}{P(B)} $$
To reiterate, it’s not esential to understand the concepts in this article.
Sensitivity and Specificity
The sensitivity of a test or, more generally, a binary classifier, is defined as the probability of the test to correctly identify the positive cases [2].
$$Sensitivity=\frac{TP}{TP+FN}$$
We can also express it as a conditional probability, by using Baye’s Theorem. Let’s say that test represents a positive result in the test, and A represents the sample actually being positive. In that case:
$$ P(test|A) = \frac{P(A|test)P(test)}{P(A)} $$
In a similar way, the specifity of a test is defined as the probability of correctly identifying those patients who are negative.
$$ Specificity=\frac{TN}{TN+FP} $$
It can also be expressed as:
$$ P(\bar{test}|\bar{A})=\frac{P(\bar{A}|\bar{test})P(\bar{test})}{P(\bar{A})} $$
This formulas might make sense to you, or not. But I don’t think learning a formula by heart is the same as understanding the concept it represents. So let’s try to show visually what these two concepts mean [3]
Below you will see a graph with a population of 100. Each one of the people in the population will either be green or red, and each one of them will have a dot representing a positive or negative test:
- A green circle means it is positive. A red circle means it is negative.
- A white dot means that the test shows a positive, and a black dot means that the test shows a negative.
This way, the 4 basic cases that we explained in Basics will be represented like this:
- TP:

- FN:

- TN:

- FP:

Let’s assume that we have:
- Population of 100 people.
- 60% incidence of the disease.
- Sensitivity of 40%.
- Specificity of 70%.
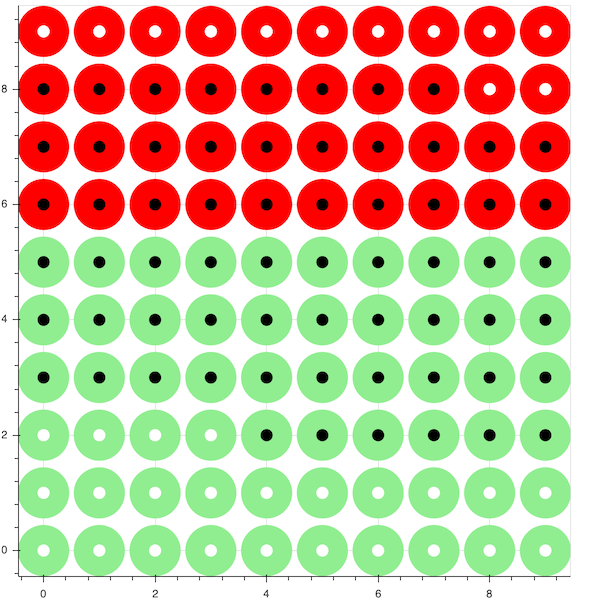
For the sensitivity of the test only the Positive cases are taken into account, this is, True Positives and False Negatives.
$$ Sensitivity=\frac{TP}{TP+FN} $$
The sensitivity of a test is independent of the prevalence of the disease in the population. In this case we have 24 True Positives, and 36 False negatives. The sensitivity is telling us what percentage of the people that actually have the disease will also test positive. Hence: 24/(24+36)=40%.
For the specificity of the test only the Negative cases are considered, this is, True Negatives and False Positives.

$$ Specificity=\frac{TN}{TN+FP} $$
Specificity, like sensitivity, is independent of the prevalence of the disease in the populacion. We have 28 True Negatives and 12 False positives. The specificity is telling us what percentage of the people that do no have the disease will also test negative. Hence: 28/(28+12)=70%.
Remember that you can use the visualization at the end of the article to play with these settings.
Negative Predictive Value and Positive Predictive Value
Imagine you are a doctor. You know that the sensitivity of the test you are using is 90%. But that only tells you the probablity of the result being positive given that the patient is positive. But you want the opposite! You want to know if the patient is positive (or negative) once you get the results of the test.
This is what the negative and positive predictive values represent.
The Positive Predictive Value (PPV) gives us the probability of a patent being positive after having tested positive.
$$ PPV=\frac{TP}{FP+FP} $$
And from a Bayesian paradigm [4]:
$$ PPV=P(A|test)=\frac{sensitivity \cdot P(A)}{sensitivity \cdot P(A) + (1-specificity)(1-P(\bar{A}))} $$
(Exercise for the reader: try to derive it yourself!)
Conversely the Predictive Negative Value represents how likelly is that a patient will be negative given that the test result is negative:
$$ NPV = \frac{TN}{TN+FN} $$
or:
$$ PPV=P(\bar{A}|\bar{test})=\frac{specificity \cdot (1-P(A))}{(1-sensitivity)P(A)+specificity(1-P(A))} $$
One interesting observation that we can already make is that PPV and NPV depend on the incidence of the disease in the population.
This means that a test with a particular sensitivity and specificity will have different PPV/NPV depending on where it’s used.
Let’s see how PPV and NPV relate to our population
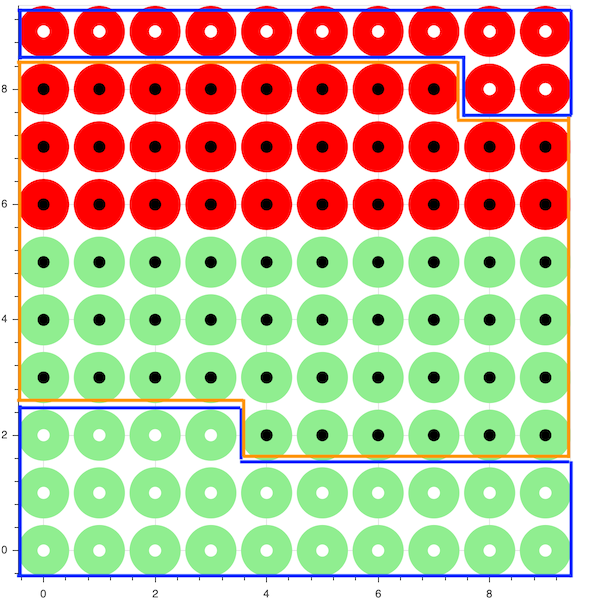
All the information contained in the blue regions is what we need for to calculate the PPV. And it’s easy to see what it’s doing. From all the test positive cases, we are only interested in the True Positives. Dividing them by the total number of test positives, gives us the PPV.
In a similar way, the test negative cases, contained in the orange rectangle, are used to calculate the NPV.
And we see as well why both of them are dependant on the prevalence in the population.
Given a fixed sensitivity and specificity, the higher the prevalence, the higher TP and the lower FP, and in consequence, the higher PPV is.
The lower the prevalence, the higher TN and the lower FN are, and the higher the NPV is.
Interactive visualization
I wrote a small visualization using Python and Javascript with Bokeh. It represents a population of 100 people and you can modify the prevalence, the sensitivity, and the specificity, and see how it affects all these numbers we have talked about. Play with it, and see if it helps you really graps these concepts.
References:
[1] - Alfageme, A. (2020). Los test rapidos de coronavirus comprados en china no funcionan bien." https://elpais.com/sociedad/2020-03-25/los-test-rapidos-de-coronavirus-comprados-en-china-no-funcionan.html
[2] - Lalkhen, A. G., & McCluskey, A. (2008). Clinical tests: sensitivity and specificity. Continuing Education in Anaesthesia Critical Care & Pain, 8(6),221–223. http://dx.doi.org/10.1093/bjaceaccp/mkn041
[3] - Loong, T. (2003). Understanding sensitivity and specificity with the right side of the brain. BMJ : British Medical Journal, 327(7417), 716–719
[4] - Altman, D. G., & Bland, J. M. (1994). Diagnostic tests 2: Predictive values. BMJ : British Medical Journal, 309(6947), 102.